Medical expert of the article

New publications
ECG analysis and interpretation
Last reviewed: 06.07.2025

All iLive content is medically reviewed or fact checked to ensure as much factual accuracy as possible.
We have strict sourcing guidelines and only link to reputable media sites, academic research institutions and, whenever possible, medically peer reviewed studies. Note that the numbers in parentheses ([1], [2], etc.) are clickable links to these studies.
If you feel that any of our content is inaccurate, out-of-date, or otherwise questionable, please select it and press Ctrl + Enter.
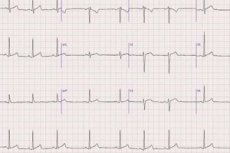
The ECG displays the processes of excitation occurrence and its conduction. The teeth are registered when there is a potential difference between the sections of the excitable system, i.e. one part of the system is covered by excitation, and the other is not. The isopotential line appears in the absence of a potential difference, i.e. when the entire system is not excited or, conversely, is covered by excitation. From the standpoint of electrocardiology, the heart consists of two excitable systems: the atria and ventricles. The transmission of excitation between them is carried out by the conduction system of the heart. Due to the fact that the mass of the conduction system is small, the potentials arising in it at normal amplifications are not captured by a standard electrocardiograph, therefore the ECG reflects the sequential coverage of the contractile myocardium of the atria and ventricles by excitation.
In the atria, excitation spreads from the sinoatrial node to the atrioventricular node. Normally, the rate of excitation spread along the atrial conduction bundles is approximately equal to the rate of spread along the contractile myocardium of the atria, so its coverage by excitation is displayed by a monophasic P wave. Excitation spreads along the ventricular myocardium by transferring excitation from the elements of the conduction system to the contractile myocardium, which determines the complex nature of the QRS complex. In this case, the Q wave corresponds to excitation of the apex of the heart, the right papillary muscle and the inner surface of the ventricles, the R wave - to excitation of the base of the heart and the outer surface of the ventricles. The process of excitation spread in the basal parts of the interventricular septum, the right and left ventricles forms the S wave on the ECG. The ST segment reflects the state of complete excitation of both ventricles, normally it is on the isopotential line, since there is no potential difference in the excitable system of the ventricles. The T wave reflects the process of repolarization, i.e. restoration of the membrane potential of the myocardial cells at rest. This process occurs asynchronously in different cells, so a potential difference arises between the still depolarized areas of the myocardium, which have a negative charge, and the areas of the myocardium that have restored their positive charge. This potential difference is recorded as the T wave. This wave is the most variable part of the ECG. An isopotential line is recorded between the T wave and the subsequent P wave, since at this time there is no potential difference in the myocardium of the ventricles and atria.
The total duration of electrical ventricular systole (QRST) is almost the same as the duration of mechanical systole (mechanical systole begins somewhat later than electrical systole).
 [ 1 ]
[ 1 ]
ECG allows to assess the nature of disturbances in the conduction of excitation in the heart
Thus, by the size of the PQ interval (from the beginning of the P wave to the beginning of the Q wave), one can judge the conduction of excitation from the atrial myocardium to the ventricular myocardium. Normally, this time is 0.12-0.2 s. The total duration of the QRS complex reflects the speed of excitation coverage of the contractile myocardium of the ventricles and is 0.06-0.1 s.
The processes of depolarization and repolarization occur in different areas of the myocardium at different times, so the potential difference between different areas of the heart muscle changes during the cardiac cycle. The conventional line connecting two points with the greatest potential difference at any given moment is called the electrical axis of the heart. At any given moment, the electrical axis of the heart is characterized by its length and direction, i.e., it is a vector quantity. A change in the direction of the electrical axis of the heart may be important for diagnostics.
ECG allows for detailed analysis of changes in heart rhythm. Normally, the heart rate is 60-80 per minute, with a rarer rhythm - bradycardia - 40-50, and with a more frequent rhythm - tachycardia - exceeds 90-100 and reaches 150 per minute and more.
Read also: ECG in pathology
In some pathological conditions of the heart, the correct rhythm is episodically or regularly disrupted by an extra contraction - an extrasystole. If an extra excitation occurs in the sinoatrial node at the moment when the refractory period has ended, but the next automatic impulse has not yet appeared, an early contraction of the heart occurs - a sinus extrasystole. The pause following such an extrasystole lasts the same time as a normal one.
An extra excitation that occurs in the ventricular myocardium does not affect the automaticity of the atrioventricular node. This node promptly sends the next impulse, which reaches the ventricles at the moment when they are in a refractory state after an extrasystole and therefore do not respond to the next impulse. At the end of the refractory period, the ventricles can again respond to irritation, but some time passes until the next impulse comes from the sinoatrial node. Thus, an extrasystole caused by an impulse that occurs in one of the ventricles ( ventricular extrasystole ) leads to a prolonged so-called compensatory pause of the ventricles with an unchanged rhythm of the atria.
Extrasystoles may appear in the presence of foci of irritation in the myocardium itself, in the area of the atrial or ventricular pacemakers. Extrasystole can also be caused by impulses coming to the heart from the central nervous system.
The ECG reflects changes in the magnitude and direction of action potentials, but does not allow one to evaluate the characteristics of the pumping function of the heart. The action potentials of the myocardial cell membrane are only a trigger for myocardial contraction, which includes a certain sequence of intracellular processes ending in shortening of the myofibrils. These successive processes are called excitation-contraction coupling.
Myocardial damage to varying degrees can be observed in any generalized infection and affect the severity and outcome of the disease. At the same time, it is assumed that persistent infectious agents, primarily viruses, can lead to the development of chronic heart damage. The most clinically significant causes of myocardial damage are enteroviruses, Epstein-Barr virus (EBV), cytomegalovirus (CMV), HIV, meningococcus, group A beta-hemolytic streptococcus, yersinia, botulinum toxin,Corynebacterium diphtheriae toxin (diphtheria), Borrelia burgdorferi (Lyme borreliosis), Toxoplasma gondii (toxoplasmosis), etc.
Despite the fact that each infectious disease has its own etiology, pathogenesis and clinical manifestations, there are general patterns of myocardial damage and corresponding changes in the ECG in the acute and late periods.
Most often, in infectious diseases, ECG reveals changes in the terminal part of the ventricular complex in the form of depression or elevation of the ST segment and a decrease in the amplitude of the T wave. The severity of myocardial damage may be indicated by conduction disturbances in the form of various atrioventricular blocks (AV blocks), left bundle branch block, and excitability disturbances in the form of ventricular tachycardia or high-grade ventricular extrasystole.
ECG signs of right bundle branch block, polytopic atrial extrasystole, ST segment elevation usually accompany pericardial damage and/or increased pressure in the pulmonary circulation.
The cardiac conduction system is affected less frequently in infectious diseases than the contractile myocardium, which is manifested on the ECG by the rarer detection of ECG signs of conduction disturbance compared to the change in the ST segment. In the case of infectious pathology, the sensitivity of the ECG is higher than that of the clinical examination method.
ECG criteria for clinically significant myocardial damage
- ST segment depression more than 2 mm from the baseline in three or more leads;
- any conduction disturbances detected for the first time;
- high grade ventricular extrasystole.
[ 6 ], [ 7 ], [ 8 ], [ 9 ], [ 10 ], [ 11 ], [ 12 ], [ 13 ], [ 14 ]
ECG criteria for severe myocardial damage
- conduction disturbances in the form of AV dissociation with idioventricular rhythm, second-degree AV block type Mobitz II, detected for the first time;
- ventricular tachycardia.