Medical expert of the article

New publications
Electroencephalography
Last reviewed: 03.07.2025

All iLive content is medically reviewed or fact checked to ensure as much factual accuracy as possible.
We have strict sourcing guidelines and only link to reputable media sites, academic research institutions and, whenever possible, medically peer reviewed studies. Note that the numbers in parentheses ([1], [2], etc.) are clickable links to these studies.
If you feel that any of our content is inaccurate, out-of-date, or otherwise questionable, please select it and press Ctrl + Enter.
Electroencephalography (EEG) is a recording of electrical waves characterized by a certain rhythm. When analyzing an EEG, attention is paid to the basal rhythm, symmetry of the brain's electrical activity, spike activity, and response to functional tests. The diagnosis is made taking into account the clinical picture. The first human EEG was recorded by the German psychiatrist Hans Berger in 1929.
Electroencephalography is a method of studying the brain by recording the difference in electrical potentials that arise during its vital functions. Recording electrodes are placed in certain areas of the head so that all the main parts of the brain are represented in the recording. The resulting recording - an electroencephalogram (EEG) - is the total electrical activity of many millions of neurons, represented mainly by the potentials of dendrites and nerve cell bodies: excitatory and inhibitory postsynaptic potentials and partially by the action potentials of neuron bodies and axons. Thus, the EEG reflects the functional activity of the brain. The presence of regular rhythm on the EEG indicates that neurons synchronize their activity. Normally, this synchronization is determined mainly by the rhythmic activity of the pacemakers (pacemakers) of the non-specific nuclei of the thalamus and their thalamocortical projections.
Since the level of functional activity is determined by non-specific median structures (reticular formation of the brainstem and forebrain), these same systems determine the rhythm, appearance, general organization and dynamics of the EEG. The symmetrical and diffuse organization of the connections of non-specific median structures with the cortex determines the bilateral symmetry and relative homogeneity of the EEG for the entire brain.
The purpose of electroencephalography
The main purpose of using electroencephalography in clinical psychiatry is to identify or exclude signs of organic brain damage (epilepsy, brain tumors and injuries, cerebrovascular and metabolic disorders, neurodegenerative diseases) for differential diagnosis and clarification of the nature of clinical symptoms. In biological psychiatry, EEG is widely used for an objective assessment of the functional state of certain structures and systems of the brain, for studying the neurophysiological mechanisms of mental disorders, as well as the effects of psychotropic drugs.
Indications for electroencephalography
- Differential diagnostics of neuroinfections with volumetric lesions of the central nervous system.
- Assessment of the severity of CNS damage in neuroinfections and infectious encephalopathies.
- Clarification of the localization of the pathological process in encephalitis.
Preparation for an electroencephalography study
Before the examination, the patient should refrain from drinking caffeine-containing beverages, taking sleeping pills and sedatives. 24-48 hours before electroencephalography (EEG), the patient stops taking anticonvulsants, tranquilizers, barbiturates and other sedatives.
Electroencephalography research technique
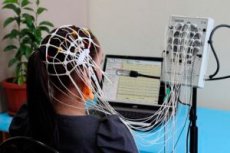
Before the examination, the patient is informed about the EEG method and its painlessness, because the emotional state significantly affects the results of the study. EEG is performed in the morning before eating in a supine position or half-lying in a chair in a relaxed state.
Electrodes on the scalp are placed in accordance with the International Scheme.
First, with the patient's eyes closed, a background (basal) EEG is recorded, then a recording is made against the background of various functional tests (activation - opening the eyes, photostimulation and hyperventilation). Photostimulation is carried out using a stroboscopic light source flashing at a frequency of 1-25 per second. During the hyperventilation test, the patient is asked to breathe quickly and deeply for 3 minutes. Functional tests can reveal pathological activity that is not detected in another situation (including a focus of seizure activity) and provoke a seizure in the patient, which is possible even after the study, so it is necessary to pay special attention to the patient in whom certain forms of pathological activity are detected.
Position of electrodes
To assess the functional state of the main sensory, motor and associative zones of the cerebral cortex and their subcortical projections using EEG, a significant number of electrodes (usually from 16 to 21) are installed on the scalp.
In order to provide the possibility of comparing EEG in different patients, the electrodes are placed according to the standard International 10-20% system. In this case, the bridge of the nose, occipital protuberance and external auditory canals serve as reference points for installing the electrodes. The length of the longitudinal semicircle between the bridge of the nose and the occipital protuberance, as well as the transverse semicircle between the external auditory canals are divided in the ratio of 10%, 20%, 20%, 20%, 20%, 10%. The electrodes are installed at the intersections of the meridians drawn through these points. The frontal-polar electrodes (Fр 1, Fрz and Fр2) are installed closest to the forehead (at a distance of 10% from the bridge of the nose), and then (after 20% of the length of the semicircle) - the frontal (FЗ, Fz and F4) and anterior temporal (F7 and F8). then - central (C3, Cz and C4) and temporal (T3 and T4), then - parietal (P3, Pz and P4), posterior temporal (T5 and T6) and occipital (01, Oz and 02) electrodes, respectively.
Odd numbers denote electrodes located on the left hemisphere, even numbers denote electrodes located on the right hemisphere, and the z index denotes electrodes located along the midline. The reference electrodes on the earlobes are designated as A1 and A2, and on the mammillary processes as M1 and M2.
Typically, electrodes for EEG recording are metal disks with a contact rod and a plastic housing (bridge electrodes) or concave “cups” with a diameter of about 1 cm with a special silver chloride (Ag-AgCI) coating to prevent their polarization.
In order to reduce the resistance between the electrode and the patient's skin, special tampons soaked in a NaCl solution (1-5%) are placed on the disk electrodes. The cup electrodes are filled with conductive gel. The hair under the electrodes is parted, and the skin is degreased with alcohol. The electrodes are secured to the head using a helmet made of rubber bands or special adhesives and are connected to the input device of the electroencephalograph using thin flexible wires.
At present, special helmets-caps made of elastic fabric have been developed, in which electrodes are mounted according to the 10-20% system, and the wires from them in the form of a thin multi-core cable are connected to the electroencephalograph using a multi-contact connector, which simplifies and speeds up the process of installing electrodes.
Registration of electrical activity of the brain
The amplitude of EEG potentials normally does not exceed 100 μV, therefore the equipment for recording EEG includes powerful amplifiers, as well as bandpass and rejection filters for isolating low-amplitude oscillations of brain biopotentials against the background of various physical and physiological interference - artifacts. In addition, electroencephalographic installations contain devices for photo- and phonostimulation (less often for video- and electrical stimulation), which are used in studying the so-called "evoked activity" of the brain (evoked potentials), and modern EEG complexes also include computer means of analysis and visual graphic display (topographic mapping) of various EEG parameters, as well as video systems for monitoring the patient.
Functional load
In many cases, functional loads are used to identify hidden disorders of brain activity.
Types of functional loads:
- rhythmic photostimulation with different frequencies of light flashes (including those synchronized with EEG waves);
- phonostimulation (tones, clicks);
- hyperventilation;
- sleep deprivation;
- continuous recording of EEG and other physiological parameters during sleep (polysomnography) or throughout the day (EEG monitoring);
- EEG recording during the performance of various perceptual-cognitive tasks;
- pharmacological tests.
Interpretation of electroencephalography results
The main rhythms that are identified on the EEG include α, β, δ, θ-rhythms.
- α-Rhythm - the main cortical rhythm of EEG-rest (with a frequency of 8-12 Hz) is recorded when the patient is awake and with his eyes closed. It is most pronounced in the occipital-parietal areas, has a regular character and disappears in the presence of afferent stimuli.
- β-Rhythm (13-30 Hz) is usually associated with anxiety, depression, use of sedatives and is best recorded over the frontal region.
- The θ-rhythm with a frequency of 4-7 Hz and an amplitude of 25-35 μV is a normal component of the adult EEG and dominates in childhood. In adults, θ-oscillations are normally recorded in a state of natural sleep.
- The δ-rhythm with a frequency of 0.5-3 Hz and different amplitude is normally recorded in a state of natural sleep, in wakefulness it is found only at a small amplitude and in small quantities (no more than 15%) with the presence of the α-rhythm in 50%. δ-oscillations exceeding the amplitude of 40 μV and occupying more than 15% of the total time are considered pathological. The appearance of the 5-rhythm primarily indicates signs of a violation of the functional state of the brain. In patients with intracranial lesions, slow waves are detected on the EEG over the corresponding area. The development of encephalopathy (hepatic) causes changes in the EEG, the severity of which is proportional to the degree of impairment of consciousness, in the form of generalized diffuse slow-wave electrical activity. The extreme expression of pathological electrical activity of the brain is the absence of any oscillations (straight line), which indicates brain death. If brain death is detected, one should be ready to provide moral support to the patient's relatives.
Visual analysis of EEG
Informative parameters for assessing the functional state of the brain, both in visual and computer analysis of EEG, include amplitude-frequency and spatial characteristics of the bioelectrical activity of the brain.
EEG visual analysis indicators:
- amplitude;
- average frequency;
- index - time occupied by a particular rhythm (in %);
- the degree of generalization of the main rhythmic and phasic components of the EEG;
- localization of the focus - the greatest expression in amplitude and index of the main rhythmic and phasic components of the EEG.
Alpha rhythm
Under standard recording conditions (a state of motionless, calm wakefulness with closed eyes), the EEG of a healthy person is a set of rhythmic components that differ in frequency, amplitude, cortical topography, and functional reactivity.
The main component of the EEG under standard conditions is the α-rhythm [regular rhythmic activity with quasi-sinusoidal waves with a frequency of 8-13 Hz and characteristic amplitude modulations (α-spindles)], maximally represented in the posterior (occipital and parietal) leads. Suppression of the α-rhythm occurs with opening and eye movements, visual stimulation, and orienting reaction.
In the α-frequency range (8-13 Hz), several more types of α-like rhythmic activity are distinguished, which are detected less frequently than the occipital α-rhythm.
- μ-Rhythm (rolandic, central, arcuate rhythm) is a sensorimotor analogue of the occipital α-rhythm, which is recorded mainly in the central leads (above the central or rolandic sulcus). Sometimes it has a specific arcuate wave form. Suppression of the rhythm occurs with tactile and proprioceptive stimulation, as well as with real or imaginary movement.
- The κ-rhythm (Kennedy waves) is recorded in the temporal leads. It occurs in a situation of high visual attention with suppression of the occipital α-rhythm.
Other rhythms. There are also θ- (4-8 Hz), σ- (0.5-4 Hz), β- (above 14 Hz) and γ- (above 40 Hz) rhythms, as well as a number of other rhythmic and aperiodic (phasic) EEG components.
 [ 7 ], [ 8 ], [ 9 ], [ 10 ], [ 11 ], [ 12 ], [ 13 ]
Factors Affecting the Result
During the registration process, moments of the patient’s motor activity are noted, as this is reflected in the EEG and may be the cause of its incorrect interpretation.
[ 14 ], [ 15 ], [ 16 ], [ 17 ], [ 18 ], [ 19 ], [ 20 ], [ 21 ], [ 22 ]
Electroencephalogram in mental pathology
EEG deviations from the norm in mental disorders, as a rule, do not have pronounced nosological specificity (with the exception of epilepsy ) and are most often reduced to several main types.
The main types of EEG changes in mental disorders: slowing and desynchronization of the EEG, flattening and disruption of the normal spatial structure of the EEG, the appearance of “pathological” wave forms.
- Slowing of the EEG - a decrease in frequency and/or suppression of the α-rhythm and an increased content of θ- and σ-activity (for example, in dementia of the elderly, in areas with impaired cerebral circulation or in brain tumors).
- EEG desynchronization manifests itself as suppression of the α-rhythm and an increase in the content of β-activity (for example, in arachnoiditis, increased intracranial pressure, migraine, cerebrovascular disorders: cerebral atherosclerosis, stenosis of the cerebral arteries).
- EEG “flattening” includes a general suppression of EEG amplitude and a reduced content of high-frequency activity [for example, in atrophic processes, with expansion of the subarachnoid spaces (external hydrocephalus), over a superficially located brain tumor or in the area of a subdural hematoma].
- Disruption of the normal spatial structure of the EEG. For example, gross interhemispheric asymmetry of the EEG in local cortical tumors; smoothing of interzonal differences in the EEG due to suppression of the occipital α-rhythm in anxiety disorders or with generalization of α-frequency activity due to almost equal expression of α- and μ-rhythms, which is often detected in depression; shift in the focus of β-activity from the anterior to the posterior leads in vertebrobasilar insufficiency.
- The appearance of "pathological" wave forms (primarily high-amplitude sharp waves, peaks, complexes [for example, the peak-wave in epilepsy)! Sometimes such "epileptiform" EEG activity is absent in conventional surface leads, but it can be recorded from a nasopharyngeal electrode, which is inserted through the nose to the base of the skull. It allows one to identify deep epileptic activity.
It should be noted that the listed features of changes in visually determined and quantitative characteristics of EEG in various neuropsychiatric diseases mainly refer to κ-background EEG recorded under standard EEG registration conditions. This type of EEG examination is possible for most patients.
Interpretation of EEG abnormalities is usually given in terms of a reduced functional state of the cerebral cortex, a deficit in cortical inhibition, increased excitability of brainstem structures, cortical-brainstem irritation, the presence of EEG signs of a reduced seizure threshold with an indication (if possible) of the localization of these abnormalities or the source of pathological activity (in the cortical areas and/or in the subcortical nuclei (deep forebrain, limbic, diencephalic or lower brainstem structures)).
This interpretation is based mainly on data on EEG changes in the sleep-wake cycle, on the reflection in the EEG picture of established local organic brain lesions and cerebral blood flow disorders in the neurological and neurosurgical clinic, on the results of numerous neurophysiological and psychophysiological studies (including data on the relationship of EEG with the level of wakefulness and attention, with the effect of stress factors, with hypoxia, etc.) and on extensive empirical experience in clinical electroencephalography.
Complications
When conducting functional tests, a seizure may occur, which must be recorded and you must be ready to provide first aid to the patient.
The use of various functional tests certainly increases the informativeness of the EEG examination, but increases the time required for recording and analyzing the EEG, leads to fatigue of the patient, and may also be associated with the risk of provoking seizures (for example, with hyperventilation or rhythmic photostimulation). In this regard, it is not always possible to use these methods in patients with epilepsy, the elderly, or young children.
Alternative methods
[ 32 ], [ 33 ], [ 34 ], [ 35 ], [ 36 ], [ 37 ]
Spectral analysis
The main method of automatic computer analysis of EEG is spectral analysis based on the Fourier transform - a representation of the native EEG pattern as a set of sinusoidal oscillations that differ in frequency and amplitude.
Main output parameters of spectral analysis:
- average amplitude;
- average and modal (most frequently occurring) frequencies of EEG rhythms;
- spectral power of EEG rhythms (an integral indicator corresponding to the area under the EEG curve and depending on both the amplitude and the index of the corresponding rhythm).
Spectral analysis of EEG is usually performed on short (2-4 sec) fragments of the recording (analysis epochs). Averaging the EEG power spectra over several dozen individual epochs with the calculation of the statistical parameter (spectral density) gives an idea of the most characteristic EEG pattern for a given patient.
By comparing the power spectra (or spectral density; in different leads, an EEG coherence index is obtained, which reflects the similarity of biopotential oscillations in different areas of the cerebral cortex. This index has a certain diagnostic value. Thus, increased coherence in the α-frequency band (especially with EEG desynchronization) is detected with active joint participation of the corresponding areas of the cerebral cortex in the activity being performed. On the contrary, increased coherence in the 5-rhythm band reflects a reduced functional state of the brain (for example, with superficially located tumors).
Periodometric analysis
Less commonly used is periodometric analysis (period analysis, or amplitude-interval analysis), when the periods between characteristic points of EEG waves (wave peaks or zero line intersections) and the amplitudes of wave peaks (peaks) are measured.
Period analysis of EEG allows us to determine the average and extreme values of the amplitude of EEG waves, average periods of waves and their dispersion, and accurately (by the sum of all periods of waves in a given frequency range) measure the index of EEG rhythms.
Compared to Fourier analysis, EEG period analysis is more resistant to interference, since its results depend to a much lesser extent on the contribution of single high-amplitude artifacts (for example, interference from the patient's movements). However, it is used less often than spectral analysis, in particular, because standard criteria for the detection thresholds of EEG wave peaks have not been developed.
Other nonlinear methods of EEG analysis
Other nonlinear methods of EEG analysis are also described, based, for example, on calculating the probability of occurrence of successive EEG waves belonging to different frequency ranges, or on determining the time relationships between some characteristic EEG fragments |EEG patterns (for example, α-rhythm spindles)| in different leads. Although experimental studies have shown the informativeness of the results of such types of EEG analysis in relation to the diagnosis of some functional states of the brain, these methods are practically not used in diagnostic practice.
Quantitative electroencephalography allows more accurately than with visual analysis of EEG to determine the localization of foci of pathological activity in epilepsy and various neurological and vascular disorders, to identify violations of the amplitude-frequency characteristics and spatial organization of EEG, in a number of mental disorders, to quantitatively assess the effect of therapy (including psychopharmacotherapy) on the functional state of the brain, as well as to carry out automatic diagnostics of some disorders and / or functional states of a healthy person by comparing individual EEG with databases of normative EEG data (age norm, different types of pathology, etc.). All these advantages allow to significantly reduce the time for preparing a conclusion based on the results of EEG examination, increase the likelihood of identifying EEG deviations from the norm.
The results of quantitative EEG analysis can be provided both in digital form (as tables for subsequent statistical analysis) and as a visual color “map” that can be easily compared with the results of CT, magnetic resonance imaging (MRI) and positron emission tomography (PET), as well as with local cerebral blood flow assessments and neuropsychological testing data. In this way, structural and functional disorders of brain activity can be directly compared.
An important step in the development of quantitative EEG was the creation of software for determining the intracerebral localization of equivalent dipole sources of the highest-amplitude EEG components (for example, epileptiform activity). The latest achievement in this area is the development of programs that combine MRI and EEG maps of the patient's brain, taking into account the individual shape of the skull and the topography of the brain structures.
When interpreting the results of visual analysis or EEG mapping, it is necessary to take into account age-related (both evolutionary and involutional) changes in the amplitude-frequency parameters and spatial organization of the EEG, as well as changes in the EEG against the background of taking medications, which naturally occur in patients in connection with treatment. For this reason, EEG recording is usually performed before the start of or after temporary discontinuation of treatment.
Ppolysomnography
Electrophysiological sleep study, or polysomnography, is one area of quantitative EEG.
The aim of the method is to objectively assess the duration and quality of night sleep, identify sleep structure disorders [in particular, the duration and latent period of different sleep phases, especially the rapid eye movement sleep phase], cardiovascular (heart rhythm and conduction disorders) and respiratory (apnea) disorders during sleep.
Research methodology
Physiological parameters of sleep (night or day):
- EEG in one or two leads (most often C3 or C4);
- electrooculogram data;
- electromyogram data;
- frequency and depth of breathing;
- general motor activity of the patient.
All these indicators are necessary for identifying sleep stages according to generally accepted standard criteria. Slow-wave sleep stages are determined by the presence of sleep spindles and σ-activity in the EEG, and the phase of sleep with rapid eye movements is determined by EEG desynchronization, the appearance of rapid eye movements and a profound decrease in muscle tone.
In addition, electrocardiogram (ECG), blood pressure, skin temperature and blood oxygen saturation (using an ear photooxygemometer) are often recorded. All these indicators allow us to assess vegetative disorders during sleep.
Interpretation of results
Shortening of the latency of the phase of sleep with rapid eye movements (less than 70 min) and early (at 4-5 am) morning awakening are established biological signs of depressive and manic states. In this regard, polysomyography makes it possible to differentiate depression and depressive pseudodementia in elderly patients. In addition, this method objectively reveals insomnia, narcolepsy, somnambulism, as well as nightmares, panic attacks, apnea and epileptic seizures that occur during sleep.