Medical expert of the article

New publications
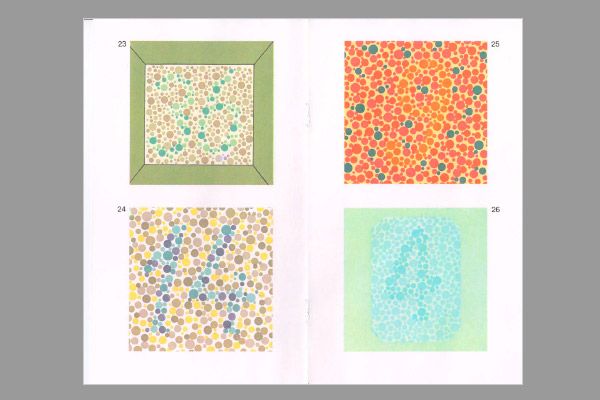
Rabkin's polychromatic tables for color perception research with pictures
Last reviewed: 06.07.2025

All iLive content is medically reviewed or fact checked to ensure as much factual accuracy as possible.
We have strict sourcing guidelines and only link to reputable media sites, academic research institutions and, whenever possible, medically peer reviewed studies. Note that the numbers in parentheses ([1], [2], etc.) are clickable links to these studies.
If you feel that any of our content is inaccurate, out-of-date, or otherwise questionable, please select it and press Ctrl + Enter.
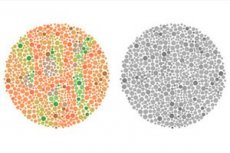
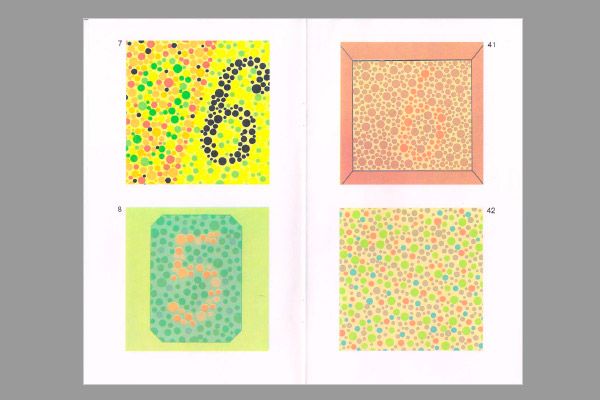
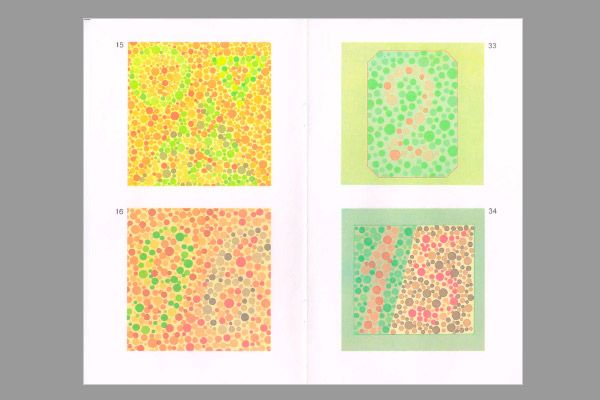
Rabkin's tables are intended for the study of color vision and diagnostics of various forms and degrees of color pathology.
The set of tables contains two groups - the main one (tables 1 - 27), intended for differential diagnostics of forms and degrees of color vision disorders, and the control one (tables 28-48) - for clarifying the diagnosis in sometimes observed cases of aggravation, simulation and dissimulation.
 [ 1 ]
[ 1 ]
Technique Rabkin's polychromatic tables for color perception research with pictures
The subject is seated with his back to the window or light source and asked to hold his head straight, without moving or turning it in different directions. The tables are placed in a strictly vertical plane at the subject's eye level at a distance of 0.5-1 m from him. The demonstration time of one table should not exceed 5 seconds. It is not recommended to place the tables on the table or hold them at an inclined plane: this may affect the accuracy of the methodology and the conclusions of the study.
Normal performance
The subject's answers are entered into a special card for recording the color perception study data. If the subject read the table correctly, they put a plus (+); if the table was read with difficulty, uncertainly, they put a question mark (?); if incorrectly - a minus sign (-).
By comparing the subject's answers with the data provided in the table for diagnosing color vision disorders, a final diagnosis is established.
Table for diagnosing color vision disorders |
||||||
Table No. |
Table readability |
|||||
N |
Dichromacy |
Anomalous trichromacy |
Pp |
|||
Pr |
De |
Pa ABC |
Yes ABC |
|||
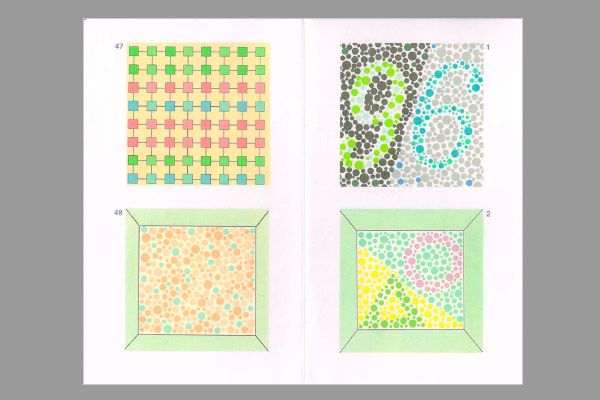
1 |
96 |
96 |
96 |
+++ |
+++ |
+ |
2 |
O∆ |
O∆ |
O∆ |
+++ |
+++ |
+ |
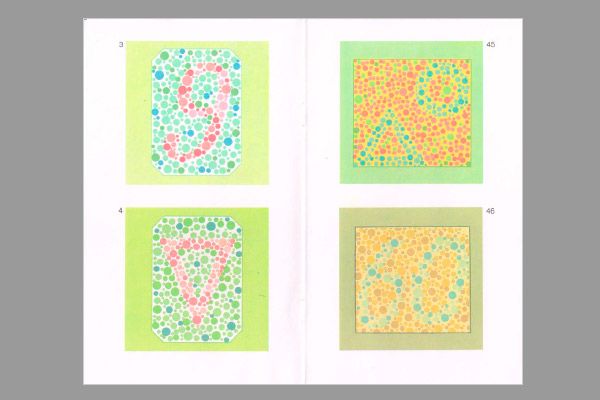
3 |
9 |
5 |
5 |
--- |
--- |
+ |
4 |
∆ |
O |
O |
--- |
--- |
- |
5 |
13 |
6 |
6 |
--- |
--- |
- |
6 |
O∆ |
- |
- |
--- |
--- |
- |
7 |
96 |
96 |
6 |
+++ |
--+ |
- |
8 |
5 |
5 |
5 |
+++ |
+++ |
- |
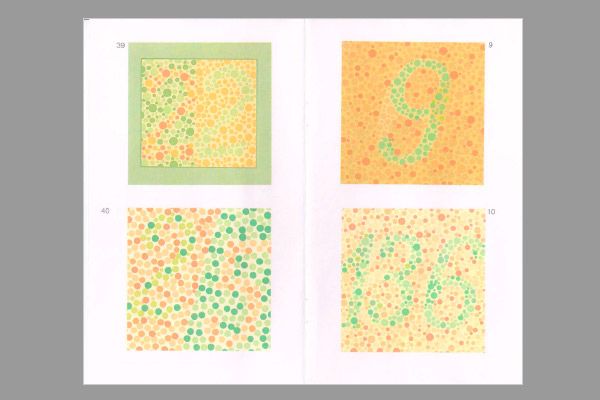
9 |
9 |
6.8 |
9 |
--- |
+++ |
+ |
10 |
136 |
68,69 |
66,69 |
--- |
--- |
- |
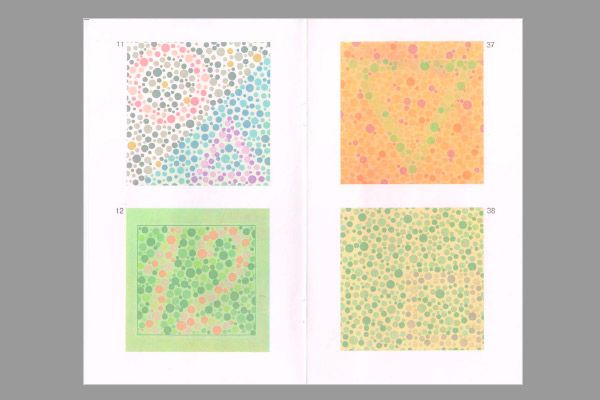
11 |
O∆ |
∆ |
O,O∆ |
--- |
+++ |
+ |
12 |
12 |
- |
12 |
--- |
+++ |
- |
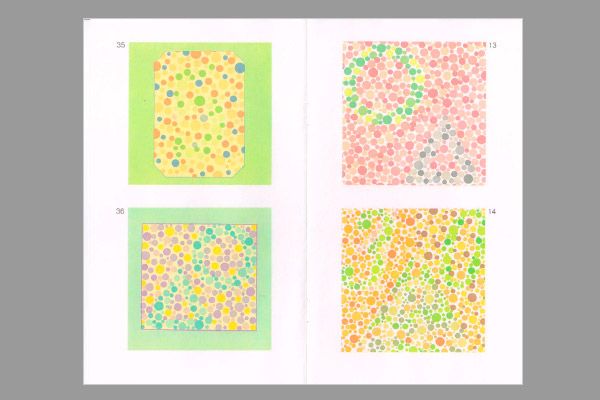
13 |
O∆ |
O |
∆ |
--- |
-++ |
+ |
14 |
30 |
106 |
16 |
--- |
--- |
- |
15 |
O∆ |
∆,∆□ |
∆□ |
--- |
--- |
- |
16 |
96 |
9 |
6 |
--+ |
--+ |
- |
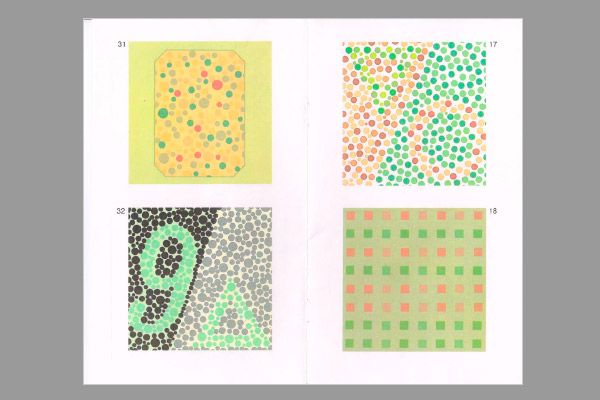
17 |
∆O |
∆ |
O |
--+ |
--+ |
- |
18 |
= |
|| |
|| |
-++ |
-++ |
+ |
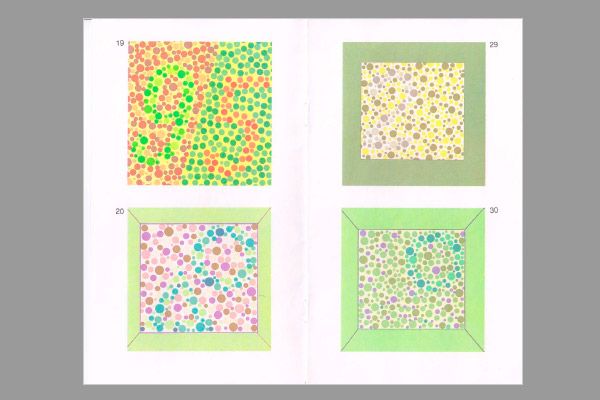
19 |
95 |
5 |
5 |
+++ |
--+ |
+ |
20 |
O∆ |
- |
- |
--- |
--- |
- |
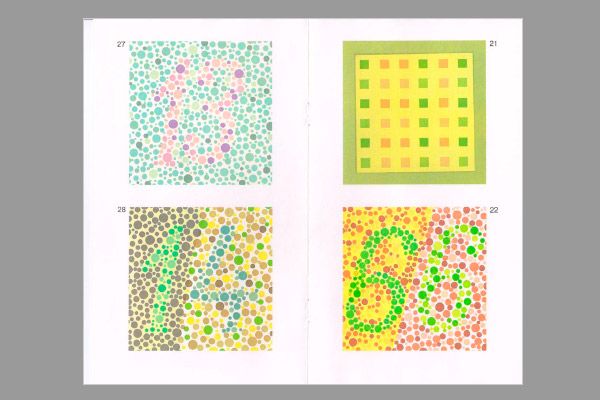
21 |
|| |
= |
= |
-++ |
-++ |
- |
22 |
66 |
6 |
6 |
--- |
--+ |
- |
23 |
36 |
36 |
36 |
+++ |
+++ |
- |
24 |
14 |
14 |
14 |
+++ |
+++ |
- |
25 |
9 |
9 |
9 |
+++ |
+++ |
- |
26 |
4 |
4 |
4 |
+++ |
+++ |
- |
27 |
13 |
- |
- |
--+ |
--+ |
- |
Control group of tables |
||||||
28 |
14 |
14 |
14 |
+ |
+ |
+ |
29 |
2 |
2 |
2 |
+ |
+ |
- |
30 |
O |
- |
- |
- |
- |
- |
31 |
2 |
- |
- |
- |
- |
- |
32 |
9∆ |
9∆ |
9∆ |
+ |
+ |
+ |
33 |
2 |
- |
- |
- |
- |
- |
34 |
15 |
- |
- |
- |
- |
- |
35 |
5 |
- |
- |
- |
- |
- |
36 |
O∆ |
- |
- |
- |
- |
- |
37 |
∆ |
O |
O |
+ |
+ |
- |
38 |
□ |
- |
- |
- |
- |
- |
39 |
22 |
- |
- |
- |
- |
- |
40 |
25 |
2 |
5 |
- |
- |
- |
41 |
6 |
6 |
6 |
+ |
+ |
- |
42 |
- |
- |
- |
+ |
+ |
+ |
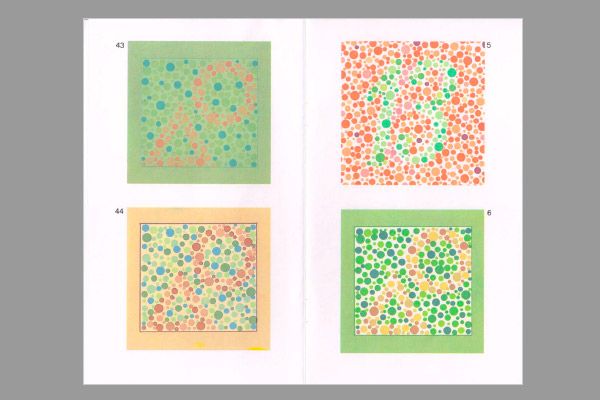
43 |
O∆ |
O∆ |
O∆ |
+ |
+ |
+ |
44 |
O∆ |
- |
- |
- |
- |
- |
45 |
O∆ |
O∆ |
O∆ |
+ |
+ |
+ |
46 |
60 |
60 |
60 |
+ |
+ |
- |
47 |
= |
|| |
|| |
- |
- |
- |
48 |
- |
- |
- |
+ |
+ |
+ |
H - normal trichromats, Pr - protanopes, De - deuteranopes, Pa - protanomaloids, De - deuteranomas, Pp - acquired pathology. "+" - correct answer; "-" - incorrect answer; «||» - vertical rows are distinguished; "=" - distinguishes horizontal rows; A, B, C – strong, moderate, weak degree of anomalies. |
||||||