Medical expert of the article

New publications
Diagnosis of osteoarthritis: radioisotope scintigraphy and thermography
Last reviewed: 06.07.2025

All iLive content is medically reviewed or fact checked to ensure as much factual accuracy as possible.
We have strict sourcing guidelines and only link to reputable media sites, academic research institutions and, whenever possible, medically peer reviewed studies. Note that the numbers in parentheses ([1], [2], etc.) are clickable links to these studies.
If you feel that any of our content is inaccurate, out-of-date, or otherwise questionable, please select it and press Ctrl + Enter.
Radioisotope scintigraphy of joints is performed using osteotropic radiopharmaceuticals (pyrophosphate, phosphone, labeled with 99m Tc). These drugs actively accumulate in areas of active bone and collagen metabolism. They accumulate especially intensively in inflamed joint tissues, which is reflected in joint scintigrams.
The method of radioisotope scintigraphy is used for early diagnosis of arthritis, detection of subclinical phases of joint damage, differential diagnosis of inflammatory and degenerative lesions.
For early diagnostics of pathological changes in joints, detection of reactive inflammation, skeletal scintigraphy with pyrophosphate labeled with 99m Tc can be used. Hyperfixation with diffuse distribution of the radioisotope is noted in the presence of reactive synovitis. In hypovascular areas of bone epiphyses, scintigrams in ischemic zones show a decrease in the accumulation of the radiopharmaceutical, whereas in areas of increased blood supply, which corresponds to areas of bone remodeling, its accumulation is uniformly increased. When comparing scintigraphy data with the results of intraosseous phlebography and measurement of intraosseous pressure, it was noted that venous stasis and increased pressure in the medullary canal are combined with abnormally high absorption of the radiopharmaceutical. In this case, the degree of its absorption is directly proportional to the stage of the degenerative-dystrophic process. Analysis of radionuclide distribution in coxarthrosis revealed increased accumulation of the labeled compound in areas of increased load, mainly in the walls of cysts and osteophytes, as well as in areas of new bone formation.
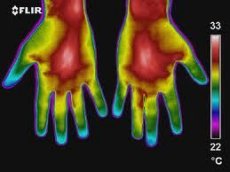
In a broad sense, thermography is a graphical recording of the thermal field of objects, i.e. their infrared radiation field, produced by various methods. A thermogram is a fixed two-dimensional image of the temperature field of a part or the entire body of the subject.
Thermography is an auxiliary diagnostic test that must be interpreted in a unified connection with clinical, laboratory, and anamnestic data obtained in accordance with the diagnostic algorithm. According to L.G. Rosenfeld and co-authors (1988), the main advantages of thermography are:
- Absolute safety. The human body is not exposed to radiation or damage. Multiple studies of the same subject are possible.
- Speed of examination. Depending on the type of thermograph, it takes from 1 min to 4 min. The time required for equilibration of the patient's skin temperature and the ambient air (15 min) can be significantly reduced if the thermography room is appropriately equipped.
- High accuracy. The minimum recorded temperature gradient between two points at a distance of one millimeter is 0.1 C. Such accuracy allows for preliminary topical diagnostics of the lesion.
- Possibility of choosing a sequence of safe research procedures for pregnant women and children.
- Possibility of simultaneous assessment of the functional state of several body systems (with overview thermography).
An important point in the accurate performance of thermography is the correct equipment of the office, as well as the preparation of the patient for the examination. The office must create conditions for stabilizing the impact of environmental factors on the thermodiagnostic equipment and the patient. For this purpose, the doors and windows are covered with thick light-protective curtains. Possible sources of IR radiation (central heating batteries) are shielded. It is recommended to maintain a temperature of 22+1 C in the examination room, since at a higher temperature there is a decrease in the contrast of thermograms, and at a lower temperature, patients develop vasoconstriction, which sharply reduces the information content of the method. The relative humidity in the office should be within 40-70%. The speed of air flow in the room should not exceed 0.15-0.2 m/s. A closed room equipped with an air conditioner meets these requirements.
In case of joint diseases of various localizations, the following rules for preparing the patient for a thermographic examination should be followed:
A. Upper limbs:
- Hands must be clean, remove nail polish.
- During the day before the examination, do not use creams, do not take physical therapy, vasodilators or vasoconstrictors.
- During the examination, the hands are freed from clothing and placed on a table-stand.
B. Lower limbs:
- The legs are freed from any bandages or compresses and are exposed to allow the skin to adapt to the room temperature.
- Do not take any medications or undergo any physiotherapy procedures during the day before the examination.
- The night before, you need to take a foot bath to remove sebum and exfoliated epidermis; remove nail polish.
- The patient is examined in a supine position, or less often in a standing position.
The study should be preceded by a period of temperature adaptation, which in adults is 10-15 minutes. Due to the fact that the temperature indicators of the human body change during the day every 3-4 hours with fluctuations of 0.2-0.4 °C, comparative (dynamic) studies are recommended to be carried out at the same time. It is also necessary to take into account that the maximum body temperature in healthy people is noted at 15-16 hours.
Correct interpretation of thermograms requires knowledge of general physiology, anatomy and special areas of medicine. Normally, a healthy person has zones of hyper- and hypothermia, caused by a number of reasons. The appearance of hyperthermia zones can be caused by:
- increased metabolism in a given organ or tissue during a certain period of time (for example, the mammary glands during lactation),
- "cavity effect" (areas of the orbits, navel, intergluteal fold, axillary, inguinal areas, interdigital spaces, medial surfaces of the lower limbs brought together or upper limbs pressed tightly to the body).
 [ 1 ], [ 2 ], [ 3 ], [ 4 ], [ 5 ], [ 6 ], [ 7 ], [ 8 ], [ 9 ]
Topographic features of normal thermograms
The back and spine on thermograms are presented with homogeneous thermotopography with slight hyperthermia in the middle part of the lumbar region. Sometimes moderate hyperthermia of the interscapular space is observed.
On the thermogram of the back, 4 constant zones of hyperthermia can be distinguished:
- in the projection of the spinous processes, starting from the level of the mid-thoracic spine; the width of the first zone is somewhat larger in the lower thoracic and upper lumbar regions compared to the lower lumbar,
- in the projection of the intergluteal fold,
- two symmetrical zones in the projection of the sacroiliac joints (lateral and slightly above the intergluteal fold),
- in the projection of the kidneys (symmetrically located areas of hyperthermia of uneven intensity).
Lumbosacral radicular syndrome results in a decrease in the skin temperature of the leg in the innervation zone of this root by 0.7-0.9 °C with simultaneous mild hyperthermia of the segment at the level of the corresponding connecting branches of the sympathetic trunk. Novocaine blockade of the affected root normalizes the surface temperature of the adequate dermatome of the limb and decreases the segment temperature in the lumbosacral region by 0.2-0.3 °C. 10-12 minutes after completion of novocaine or trimecaine blockade of the lumbar sympathetic nodes, the skin temperature of the foot and lower leg of the corresponding side increases by 0.7-0.9 °C, which lasts for 2-3 minutes.
The average skin temperature in the back and spine area is 33.5-34.2 °C.
Upper limbs
Thermographic images of both upper limbs are characterized by symmetry, although according to G. M. Frolov and co-authors (1979), slight thermal asymmetry of the upper limbs is noted, caused by the predominant development of the right or left limb or the difference in arterial pressure.
Hyperthermia zones on thermograms of the upper limbs are normally determined in the area of vascular bundles - the inner surface of the shoulder, elbow joint, forearm, axillary region. Relative hypothermia is characteristic of the outer surface of the shoulder and forearm, fingers (compared to the palms). In the area of the first finger of the hand, interdigital spaces, along the large veins on the back of the hand, moderate hyperthermia is noted. The average skin temperature in the area of the upper limbs (except for the fingers) is 31.2-32.6 C, fingers - 27.2-28.6 C.
Lower limbs
Thermographic imaging of both lower extremities is also symmetrical. In the upper and middle thirds of the shins, zones of pronounced hyperthermia are determined, while in the area of the knee joint, lower third of the shin and foot, areas of hypothermia are noted.
Thermograms of the dorsal surface of the feet show a heterogeneous picture with a tendency for hyperthermia to decrease from top to bottom - a hypothermia zone is determined in the toe area. On the plantar surface of the feet, the intensity of hyperthermia is more pronounced along the medial edge, especially in the projection of the arch of the foot. Hypothermia zones are registered along the lateral edge and in the toe area.
On the back of the thighs, a zone of pronounced hypothermia is determined in the projection of the buttocks and a zone of hyperthermia in the upper third of the thighs, popliteal fossa, and upper third of the shins. The shins are characterized by a tendency to decrease in the intensity of hyperthermia in the distal direction. A zone of hypothermia is determined above the Achilles tendon. The average value of the skin temperature in the lower limbs (except for the toes) is 32.1-32.4 °C, and for the toes it is 23.3-23.9 °C.
Analysis and processing of thermograms is carried out according to the following thermographic features:
- detection of thermal asymmetry,
- study of the area of an asymmetric section (hypo- or hyperthermia zone): dimensions, degree of homogeneity, characteristics of boundaries, etc.,
- determination of the temperature gradient and calculation of its coefficient, expressing the ratio of the temperature difference between points and the distance between them,
- determination of the maximum, minimum and average absolute temperature of symmetrical sections,
- determination of the thermographic index (TI), which is the ratio of the sum of temperatures corresponding to each isothermal field to the total area of the zone of pathological thermal asymmetry.
Normally, the thermographic index ranges from 4.62 to 4.94, averaging 4.87.
According to N. K. Ternovoy and co-authors (1988), in osteoarthrosis of the first radiographic stage according to N. S. Kosinskaya, thermal asymmetry of the joints is observed, a hypothermia zone above the joint area, gradually turning into a hyperthermia zone above and below the segments of the limb. The temperature gradient in the hypothermia zone is 0.6+0.2 °C.
Thermograms of patients with stage II-III osteoarthrosis show thermal asymmetry, a hyperthermia zone above the affected joint of varying relief and severity, indicating hypervascularization of the joint and aseptic inflammation in the synovial membrane of the joint and paraarticular tissue. The temperature gradient of the pathologically altered joint is 1±0.2 °C.
In case of effective treatment, the thermogram is characterized by a decrease in temperature asymmetry, a decrease in the intensity of hyperthermia, and the temperature gradient drops to 0.4-0.8 °C.
A study of the relationship between data from remote computed thermography (RCT), radiography and ultrasound of knee joints affected by osteoarthritis was conducted at the Ukrainian Rheumatology Center.
The study involved 62 patients with knee osteoarthritis meeting the ACR classification criteria (1986), including 43 (69.4%) women and 19 (30.6%) men aged 47 to 69 years (mean 57.4±6.2 years) who had been ill for 1.5 to 12 years (mean 5.6±2.6 years). Monoarticular lesions of the knee joints were detected in 44 (71%) patients, bilateral - in 18 (29%), thus, in total, 80 knee joints were examined in patients of the main group. X-ray stage 1 according to Kellgren and Lawrence was diagnosed in 23 (28.8%), II - in 32 (40%), III - in 19 (23.8%) and IV - in 6 (7.4%) patients. For comparison, 54 X-rays of the knee joints of 27 individuals were used, who made up the control group, in whose anamnesis there was no data on traumatic or any other damage to the knee joints, as well as vessels, soft tissues, bones and other joints of the lower extremities. Among the 27 individuals in the control group, there were 18 (66.7%) women and 9 (33.3%) men aged from 31 to 53 years (on average 41.5 + 4.9 years).
X-ray examination of the knee joints was performed in the anteroposterior projection using the standard method. Grading of X-ray criteria of osteoarthrosis from 0 to 3 degrees (decrease in the height of the joint space and osteophytosis) was performed using the Atlas of Grading of Osteoarthrosis of the Knee Joints by Y. Nagaosa et al. (2000).
When conducting DCT using the Raduga-1 thermal imager, we used the recommendations of L.G. Rosenfeld (1988). On the knee joint thermogram, two symmetrical areas measuring 35x35 mm were selected, which corresponded to the medial and lateral parts of the tibiofemoral segment of the knee joint (TFKJ), where the average temperature was determined. For mathematical processing of the DCT results, the temperature gradient index was determined using the formula:
ATm = Tm - Trm and ATl = Tl - Trl,
Where AT is the temperature gradient, Tm and Tl are the temperatures of the areas in the projection of the medial and lateral regions of the TFKS, Trm and Trl are the reference values of the temperatures of the areas in the projection of the medial and lateral regions of the TFKS, obtained during the examination of healthy individuals in the control group.
All examined individuals underwent ultrasound examination of the knee joints using the SONOLINE Omnia (Siemens) device with a 7.5L70 linear sensor (frequency 7.5 MHz) in the "ortho" mode in standard positions. The condition of the bone articular surfaces (including the presence of "loosening" of the cortical layer and its defects), joint spaces, periarticular soft tissues, the presence of effusion, changes in the ligamentous apparatus and some other parameters were assessed.
In patients of the main group, clinical signs of articular syndrome were also studied. For this purpose, the Lequesne algofunctional index (LAI) of gonarthrosis severity was used, which was determined by the nature of the pain syndrome (time of occurrence, maximum walking distance without pain), duration of morning stiffness, etc. The severity of gonarthrosis was coded in points (1-4 - weak, 5-7 - moderate, 8-10 - severe, 11-13 - significantly severe, more than 14 - severe). The intensity of the pain syndrome was assessed using the visual analog pain scale (VAS), where the absence of pain corresponds to 0 mm, and maximum pain - 100 mm.
Statistical analysis of the obtained results was performed using the STATGRAPHICS plus v.3 computer program. When conducting the correlation analysis, the correlation coefficient r < 0.37 indicated the presence of a weak, 0.37 < r < 0.05 - moderate, 0.5 < r < 0.7 - significant, 0.7 < r < 0.9 - strong and r > 0.9 - very strong relationship. The value p < 0.05 was considered reliable.
Clinical examination of patients revealed mild severity of gonarthrosis in 8 (12.9%), moderate - in 13 (20.9%), severe - in 21 (33.9%), significantly severe - in 15 (24.2%), and sharply severe - in 5 (8.1%) patients. Nine (14.5%) patients did not complain of pain in the affected joints, while another 53 (85.5%) rated the pain intensity according to VAS from 5 to 85 mm. Limitation of range of motion from 75 to 125° was found in 38 (61.2%), and an increase in extension range from 5 to 20° was found in 19 (30.6%) patients.
Clinical characteristics of joint syndrome in examined patients with osteoarthritis
Indicator |
M±sg |
AFI Lekena |
8.87±3.9 |
YOUR pain, mm |
35.48±23.3 |
Flexion range, ° (normal 130-150°) |
128.15+20 |
Extension range, ° (normal 0") |
3.23±5.7 |
The study of knee joint thermograms in the examined patients with osteoarthrosis showed that on average DTM was 0.69±0.26 °C, and DTL was 0.63+0.26 °C (p=0.061). Correlation analysis revealed a statistically significant relationship between DTM and all the clinical parameters studied, as well as between DTL and Leken's AFI, VAS pain and flexion range.
When conducting a correlation analysis, a statistically significant direct relationship was found between the temperature gradient in the medial TFJ and a decrease in the height of the joint space in the medial region, as well as osteophytosis in the medial and lateral regions, while the temperature gradient of the lateral TFJ correlated with a decrease in the height of the joint space and osteophytosis only in the lateral TFJ.
According to ultrasound data, patients with osteoarthrosis were found to have a narrowing of the joint space due to a decrease in the height of the articular cartilage (transverse position of the sensor), bone growths (osteophytes) and/or defects of the articular surface of the bones, changes in the synovial membrane and the presence of effusion in the joint, changes in paraarticular soft tissues (all positions). Changes in the surfaces of the cortical layer of the articular surface of the bones (unevenness, formation of surface defects) were recorded already in the initial stages of the disease (stage I) and reached their maximum expression at stages III-IV.
Joint effusion was recorded in 28 patients (45.16%), mainly at stages II and III of osteoarthrosis, which was mainly localized in the superior recess (32.3% of patients in the lateral part of the joint space (17.7%), less often in the medial (9.7%) and in the posterior recess (3.2%). The effusion had a homogeneous anechoic echostructure under the condition of clinical symptoms lasting up to 1 month, and in patients with clinical signs of persistent inflammation - non-homogeneous with inclusions of varying size and echo density. The thickness of the synovial membrane was increased in 24 (38.7%) patients, and its uneven thickening was recorded in 14 of them. The average duration of the disease in this group was longer than in the whole (6.7±2.4 years), and in patients with uneven thickening of the synovial membrane it was even longer (7.1 + 1.9 years). Thus, the characteristics of synovitis reflected the duration of the disease and the severity of the course at the time of examination. The data comparing the results of DCT and ultrasound are noteworthy.
A strong or very strong direct relationship according to the correlation analysis data is noted between the temperature gradient in the medial and lateral TFJ, on the one hand, and joint effusion and synovial membrane thickening according to ultrasound data, on the other. A weaker relationship was found between the presence of bone growths in the medial area of the TFJ (ultrasound data) and the temperature gradient in all examined areas of the joint.
A correlation was found between the DCT data, on the one hand, and the clinical characteristics of the joint syndrome in the examined patients with osteoarthrosis, the radiographic stage of the disease and the ultrasound results, on the other. The data obtained indicate the advisability of using a set of instrumental diagnostic methods, including radiography, DCT and ultrasound, which provides a greater volume of information about the state of not only intra-articular but also extra-articular tissues.